
With Reports, you can summarise the key metrics from SISTRIX in a single document and have them sent automatically to clients, management or other stakeholders, without any manual effort required each time. We’ll show you how to create and customise a report, and set up automated sending.
Want to delve deeper?
If you’d like to learn even more about SISTRIX reports, our training courses are just the thing for you. We offer online seminars and face-to-face workshops where you can expand your knowledge in a targeted way and ask questions straight away. You can find all the details and dates at sistrix.com/seminar
What are reports?
Reports allow you to compile the key metrics from SISTRIX that are relevant to your client reporting and have them sent automatically to stakeholders – such as clients, management or other teams. You can select the specific data boxes relevant to the issue at hand, supplement them as required with your own analysis and recommendations for action in the form of text and images, and export the report as a PDF or PowerPoint file. You can then have it sent automatically at set intervals – or share it via a publicly accessible link without the recipient needing to log in to SISTRIX.
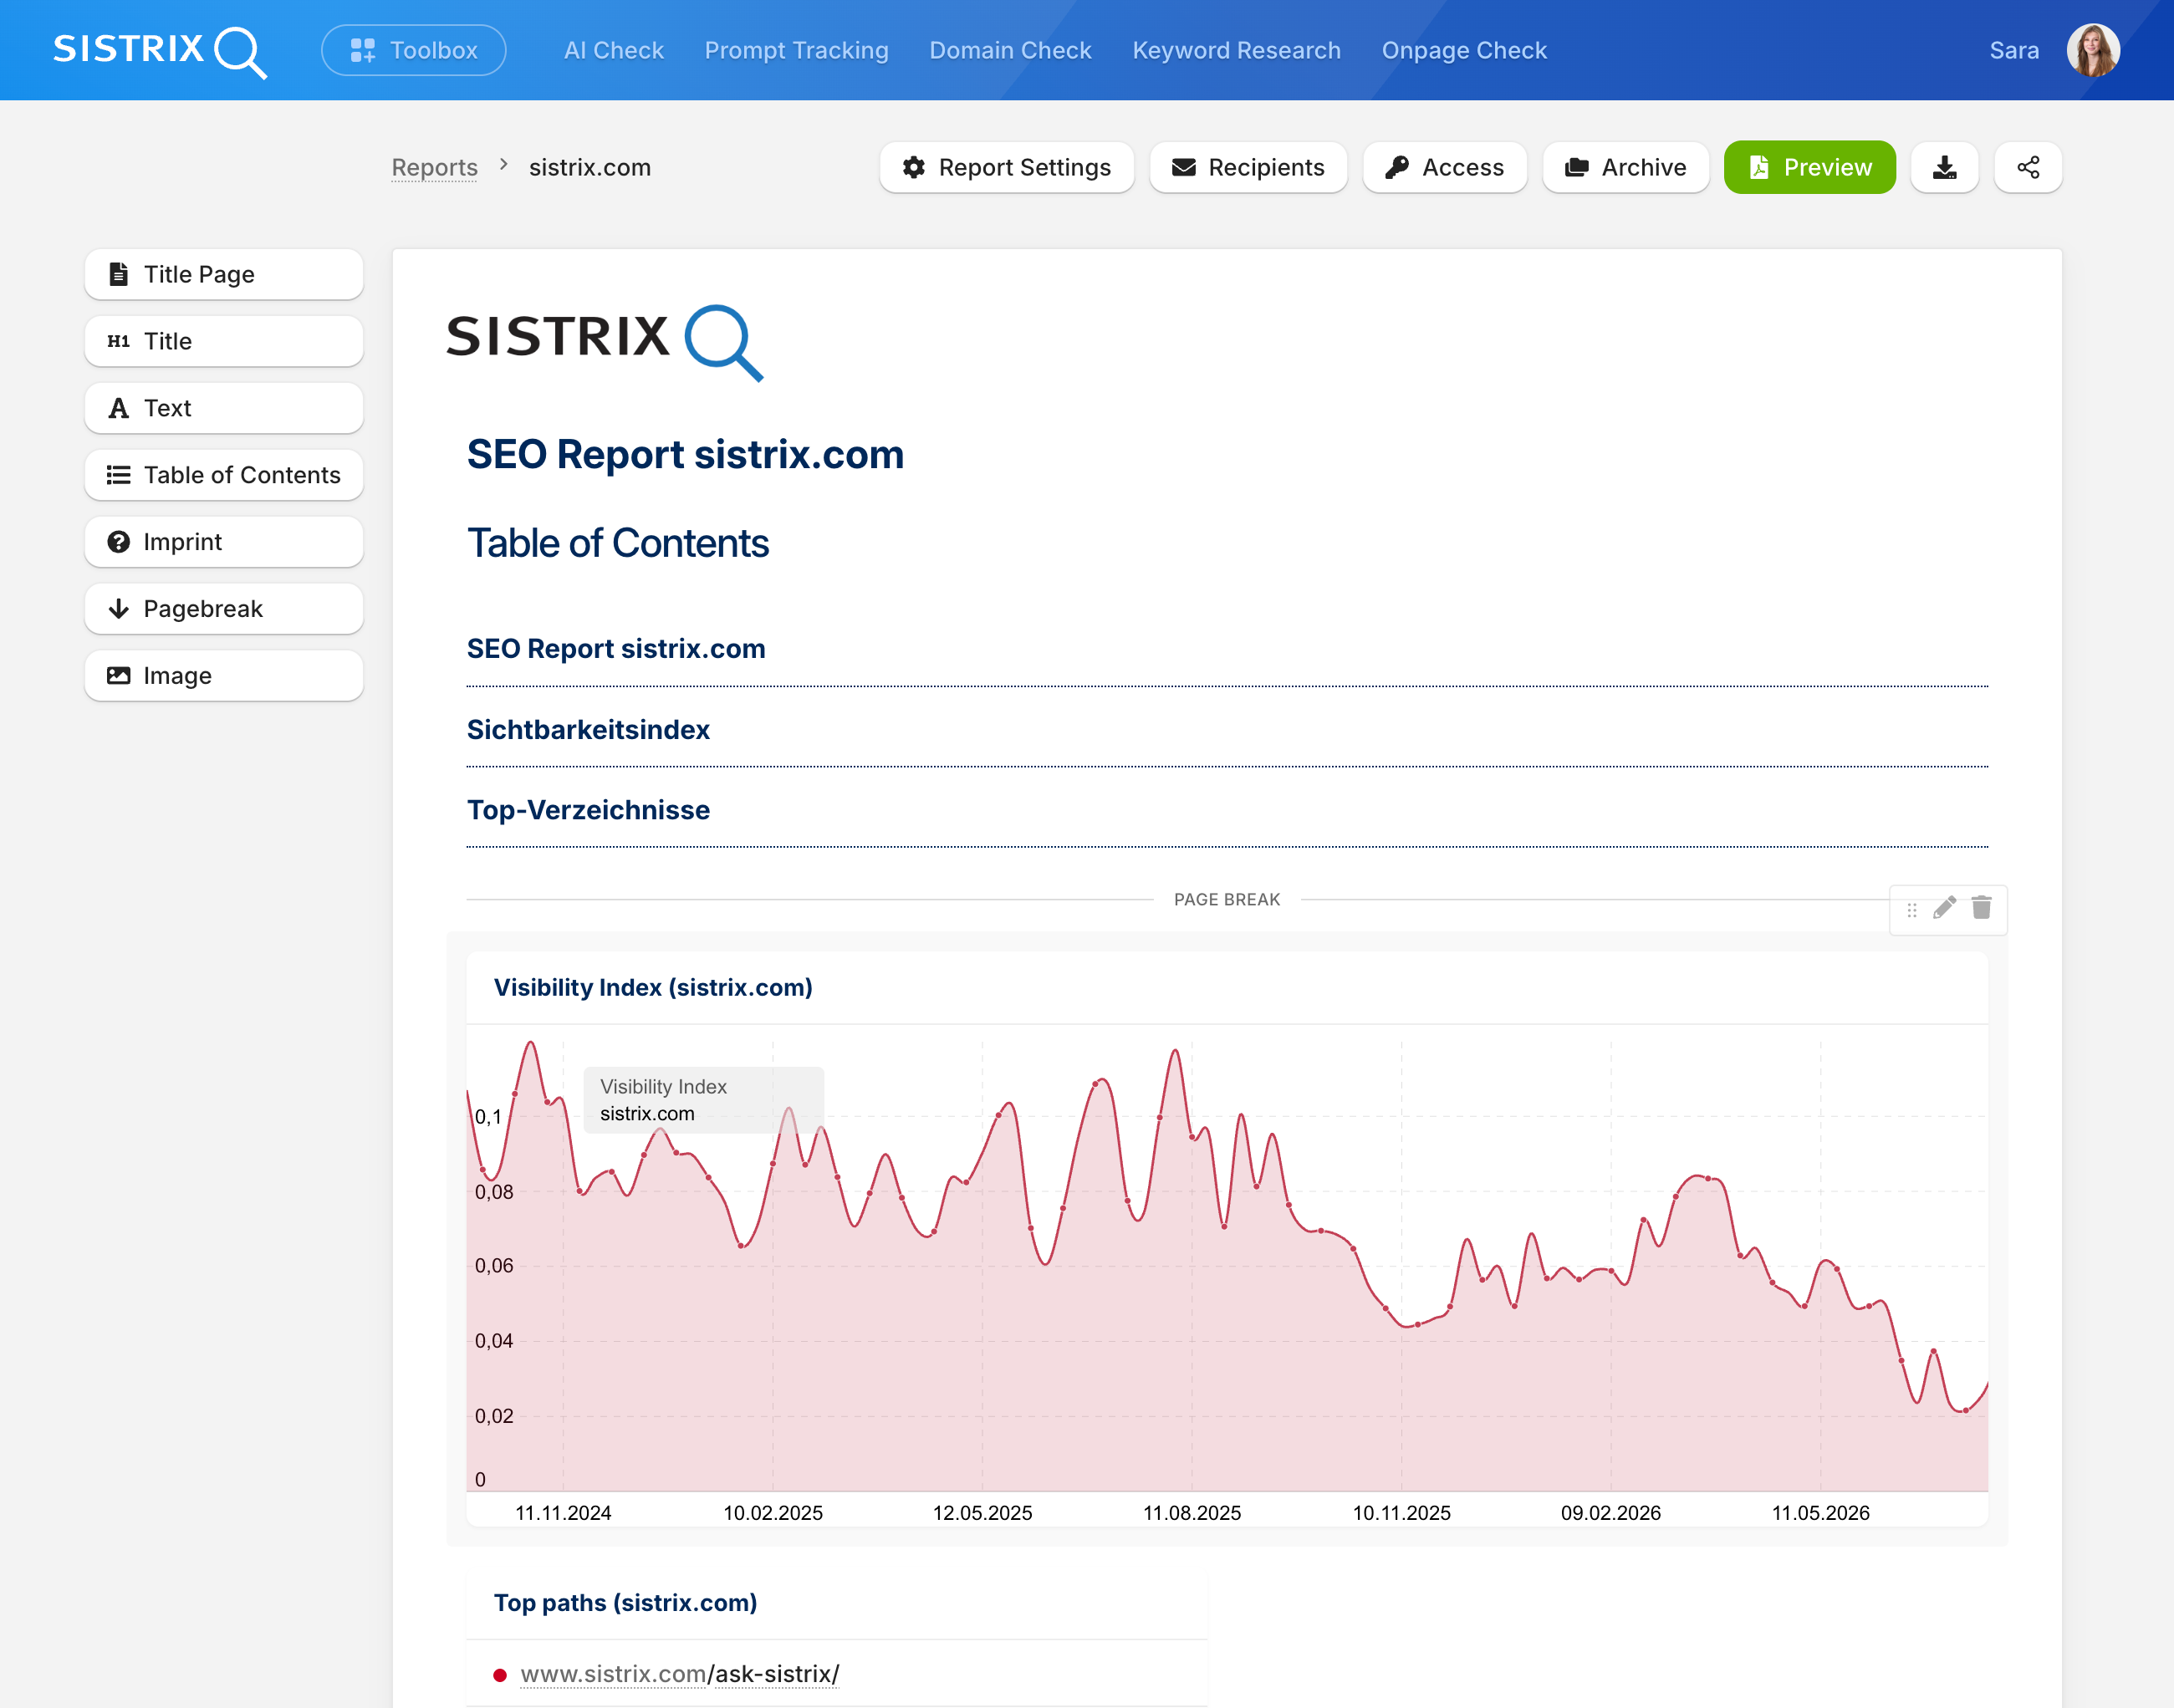
You have complete flexibility in terms of both content and design: you can put together each report individually using the data boxes relevant to you, and also adapt the design to match your own corporate identity or that of your clients – from using your own colours to white labelling without any SISTRIX branding. The exact range of features may depend on your SISTRIX package; if you have any questions, our support team will be happy to help.
In September 2026, we carried out a fundamental overhaul of the reports. Over the last few years, SISTRIX has evolved from a purely Google-focused tool into a platform for visibility across AI search, SEO, content and Amazon – and this is now also reflected in the reporting: A report can now map a brand’s visibility across multiple channels – not just in Google Search, but also on Amazon and in AI systems. This means you can now set up comprehensive reporting across multiple channels.
Reports or dashboards? You use dashboards for your own ongoing monitoring directly within SISTRIX. Reports, on the other hand, are the format for external communication: as a document or sent automatically by email to everyone who needs to be kept regularly updated on the status without having to work in SISTRIX themselves.
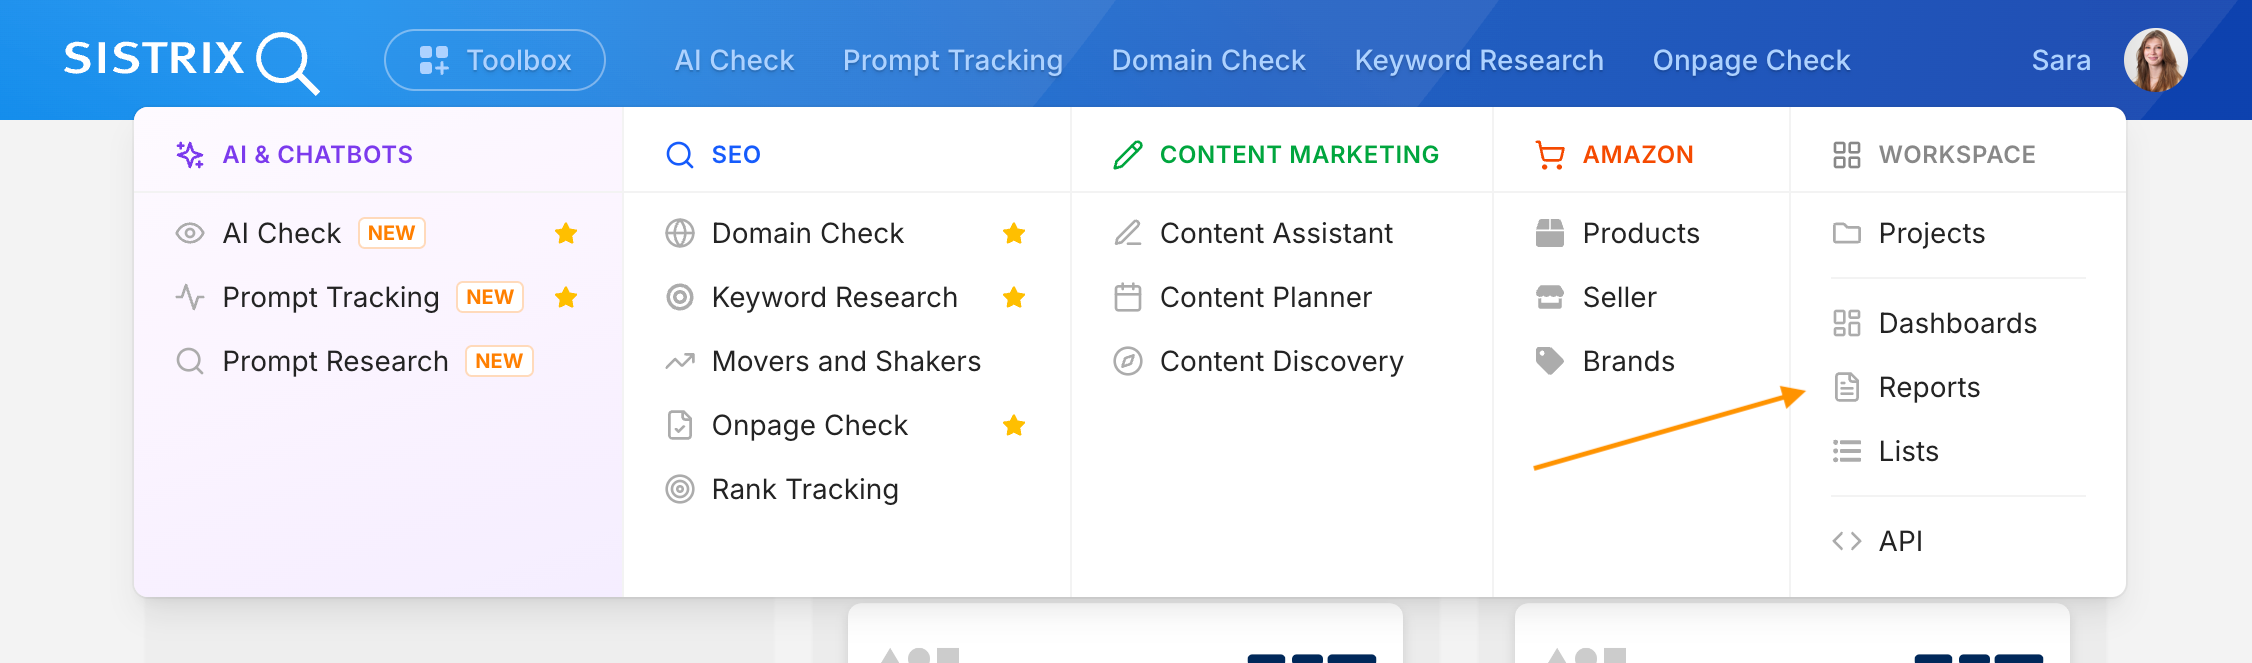
Finding reports: Reports are located in the ‘Workspace’ menu section, alongside projects, dashboards, lists and the API. From there, you can go directly to the report overview page, which shows all reports and templates that have already been created. If you use reports frequently, you can also mark the menu item as a favourite (star icon) – you’ll then find it directly in the navigation bar.
To find out which metrics should be included in a comprehensive SEO report, read our article ‘SEO Report: Structure, KPIs and Creation’.
Creating a report
To transfer a data box from SISTRIX into a report, first navigate to the analysis relevant to your report – such as a domain’s visibility history or a keyword analysis. Click on the cog icon in the top right-hand corner of the relevant box and select ‘Add to report’.
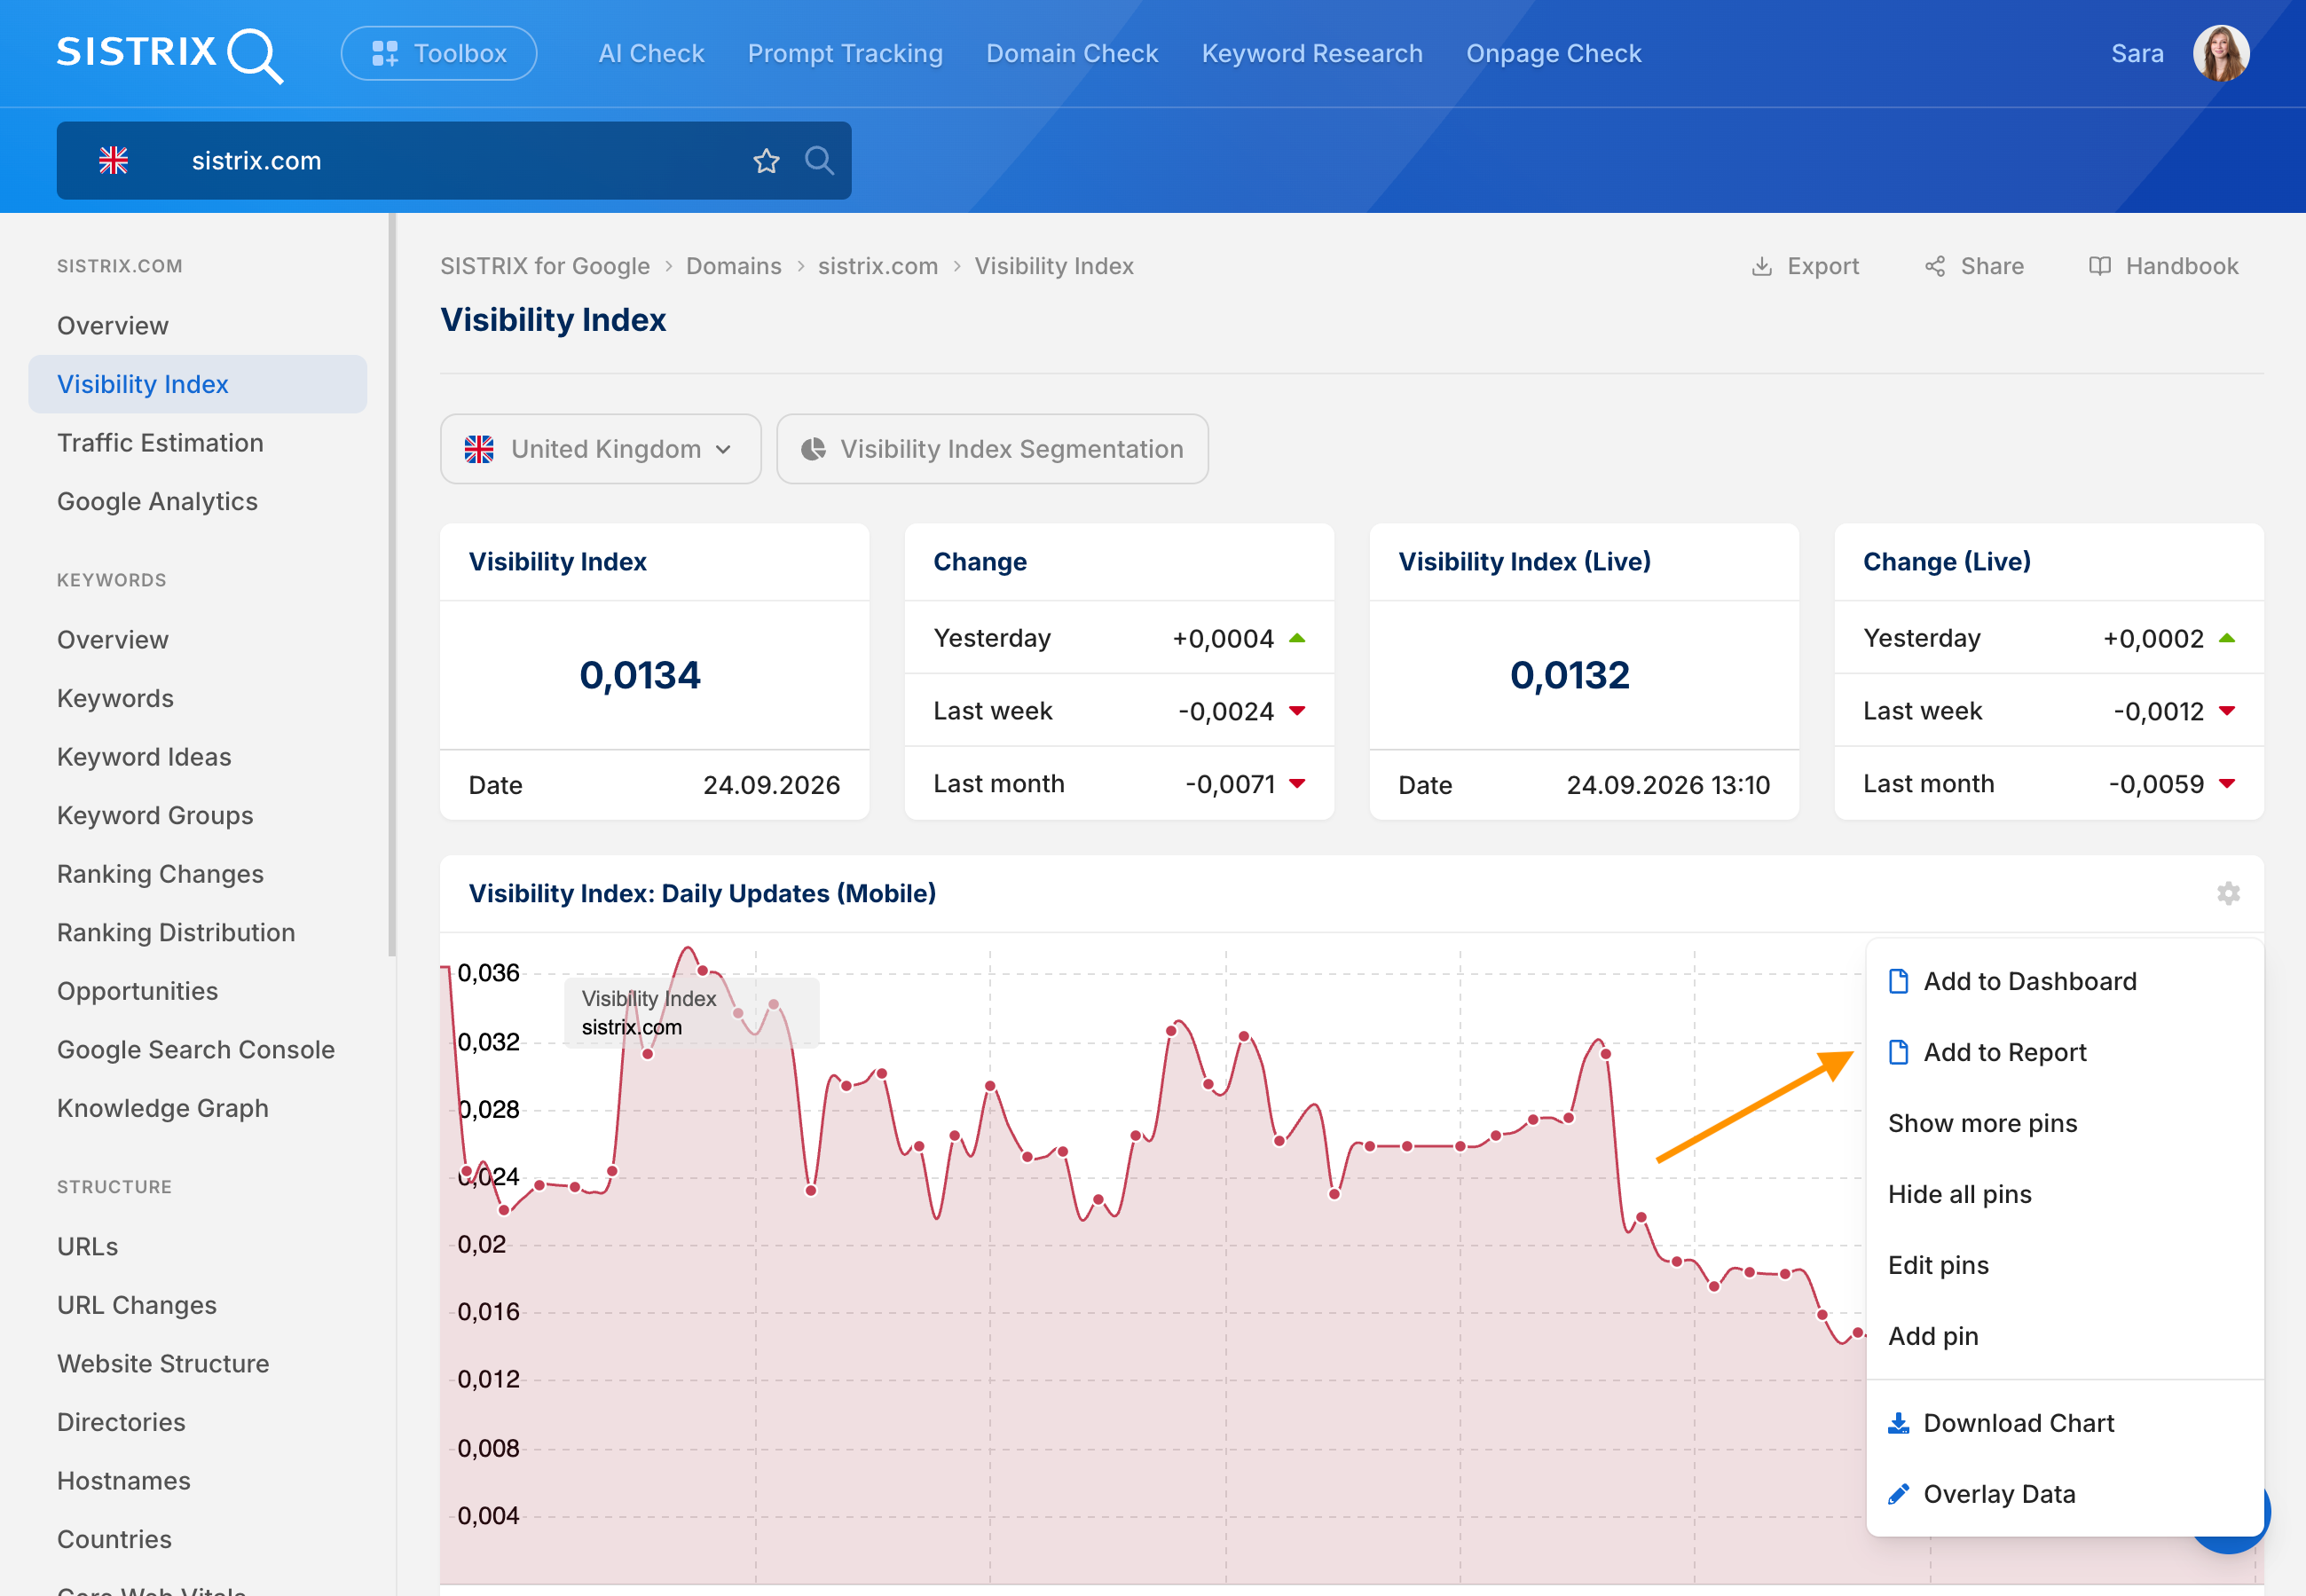
You then decide whether the box should be included in an existing report or whether a new report should be created. You do this for all boxes relevant to the respective analysis – almost every data box in SISTRIX can be included in a report in this way.
Basic settings
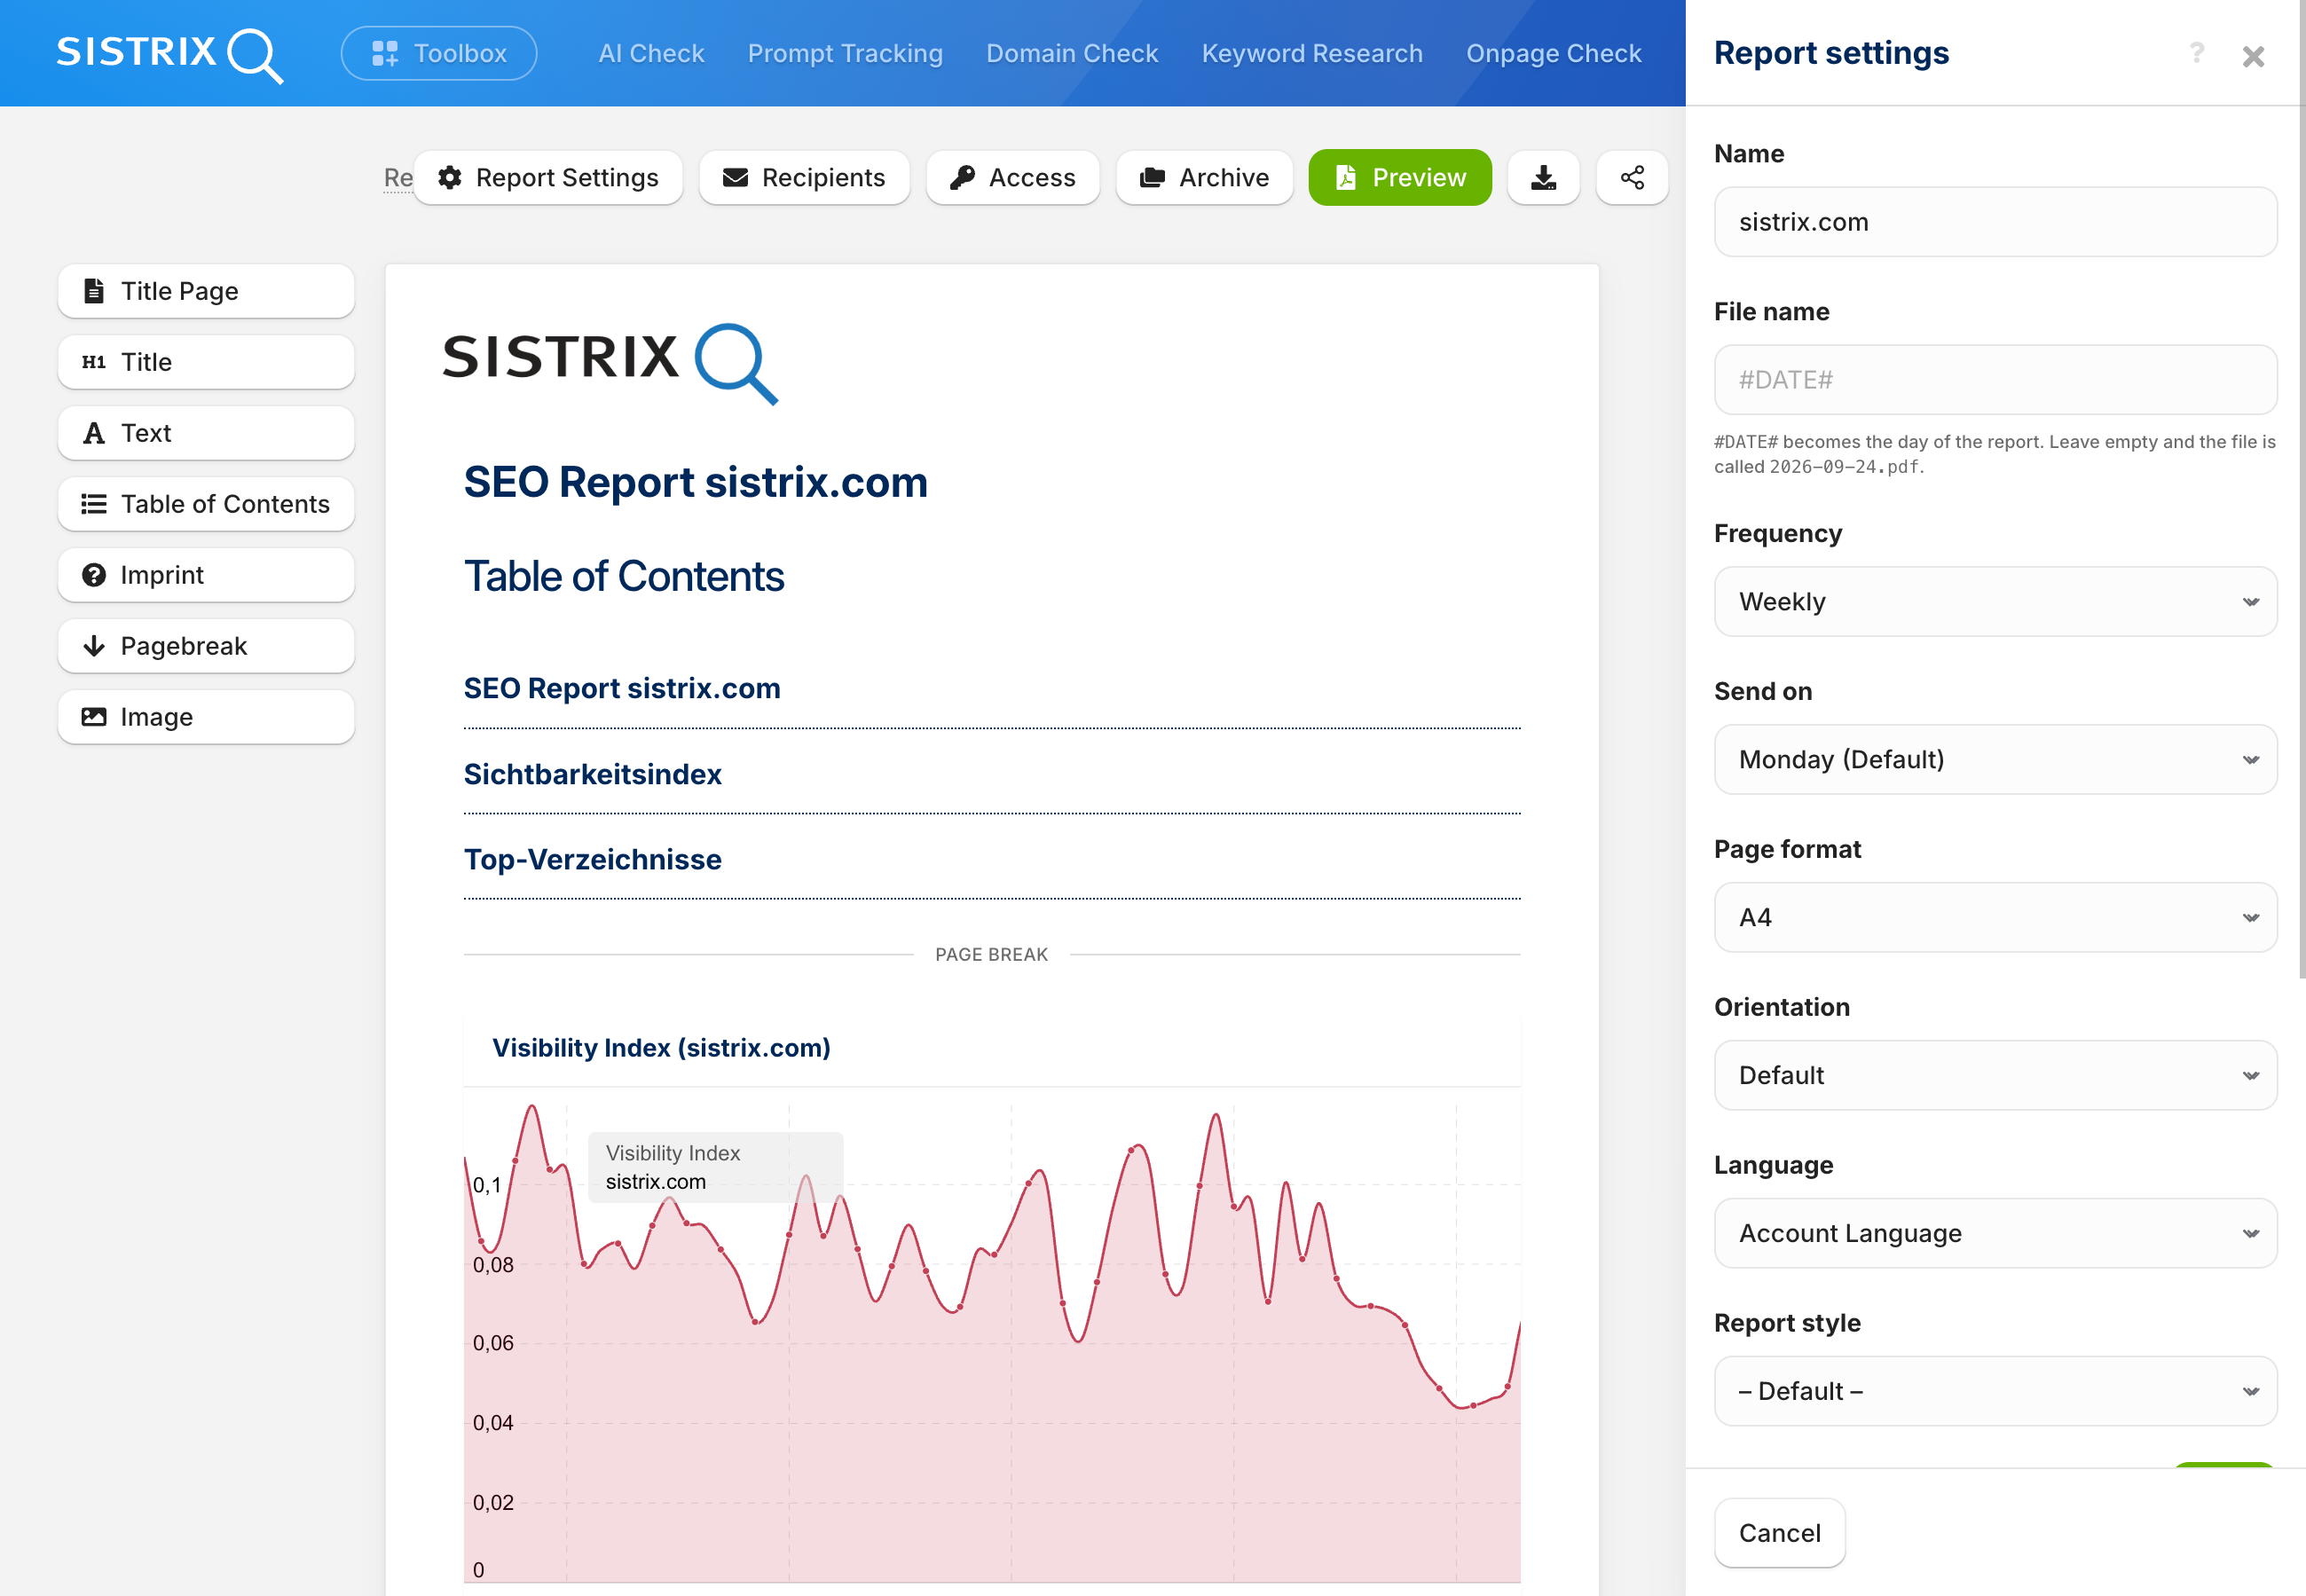
Use the ‘Report settings’ button at the top of the report editor to define the basic parameters for your report:
- Report name: the internal title under which you’ll find the report in the overview.
- File name: the name of the file under which the report is saved or sent as a PDF or PowerPoint.
- Page size: A4 or A3.
- Page orientation: landscape or portrait.
- Language: the account language automatically, or optionally German, English, French, Italian or Spanish for the labels in the data boxes.
- Report style: a template provided by SISTRIX or your own design template.
Designing a report
Use the left-hand panel in the report editor to add additional design elements to your report:
- Title page: a separate page displaying the name of the report.
- Page title: a heading that automatically appears in the table of contents.
- Text block: a free text area that you can format as you wish – for example, alignment, bold text and font size. You can access the available formatting options by clicking below the text input field.
- Table of contents: generated automatically from the page titles and data boxes.
- Legal notice: placed at the end of the report.
- Page break: a manual break at the desired position.
- Image: upload your own image.
You can arrange the data boxes and design elements in the desired order using drag and drop. When you hover your mouse over a data box, a pencil and a bin icon appear in the top right-hand corner: Click the pencil to open the box’s individual settings – for some boxes, you can, for example, adjust the width there to display two boxes side by side (other boxes do not allow this and are always displayed across the full width of the page); for visibility schedules, you can, for example, specify there whether event pins are also displayed. Click the bin to remove the element from the report.
Setting up automated sending
You can set the sending frequency in the basic settings (see the ‘Report Settings’ section): daily, weekly or monthly. If you choose weekly sending, you can also select the specific day of the week from any of the days of the week.
If you do not need automated dispatch for a short period – for example, during a project break or if a report is currently not relevant – you can temporarily disable dispatch using the ‘Paused’ option without having to delete the report and its configuration straight away. As soon as you reactivate it, the previously set frequency will resume.
You can specify who receives the report using the ‘Recipients’ button at the top of the report editor. Clicking this opens a settings window where you can manage the recipient list for automated, regular dispatch, as well as trigger a one-off or immediate dispatch to these recipients – regardless of the next scheduled dispatch date, for example to respond at short notice to a current customer enquiry.
Manage & share access
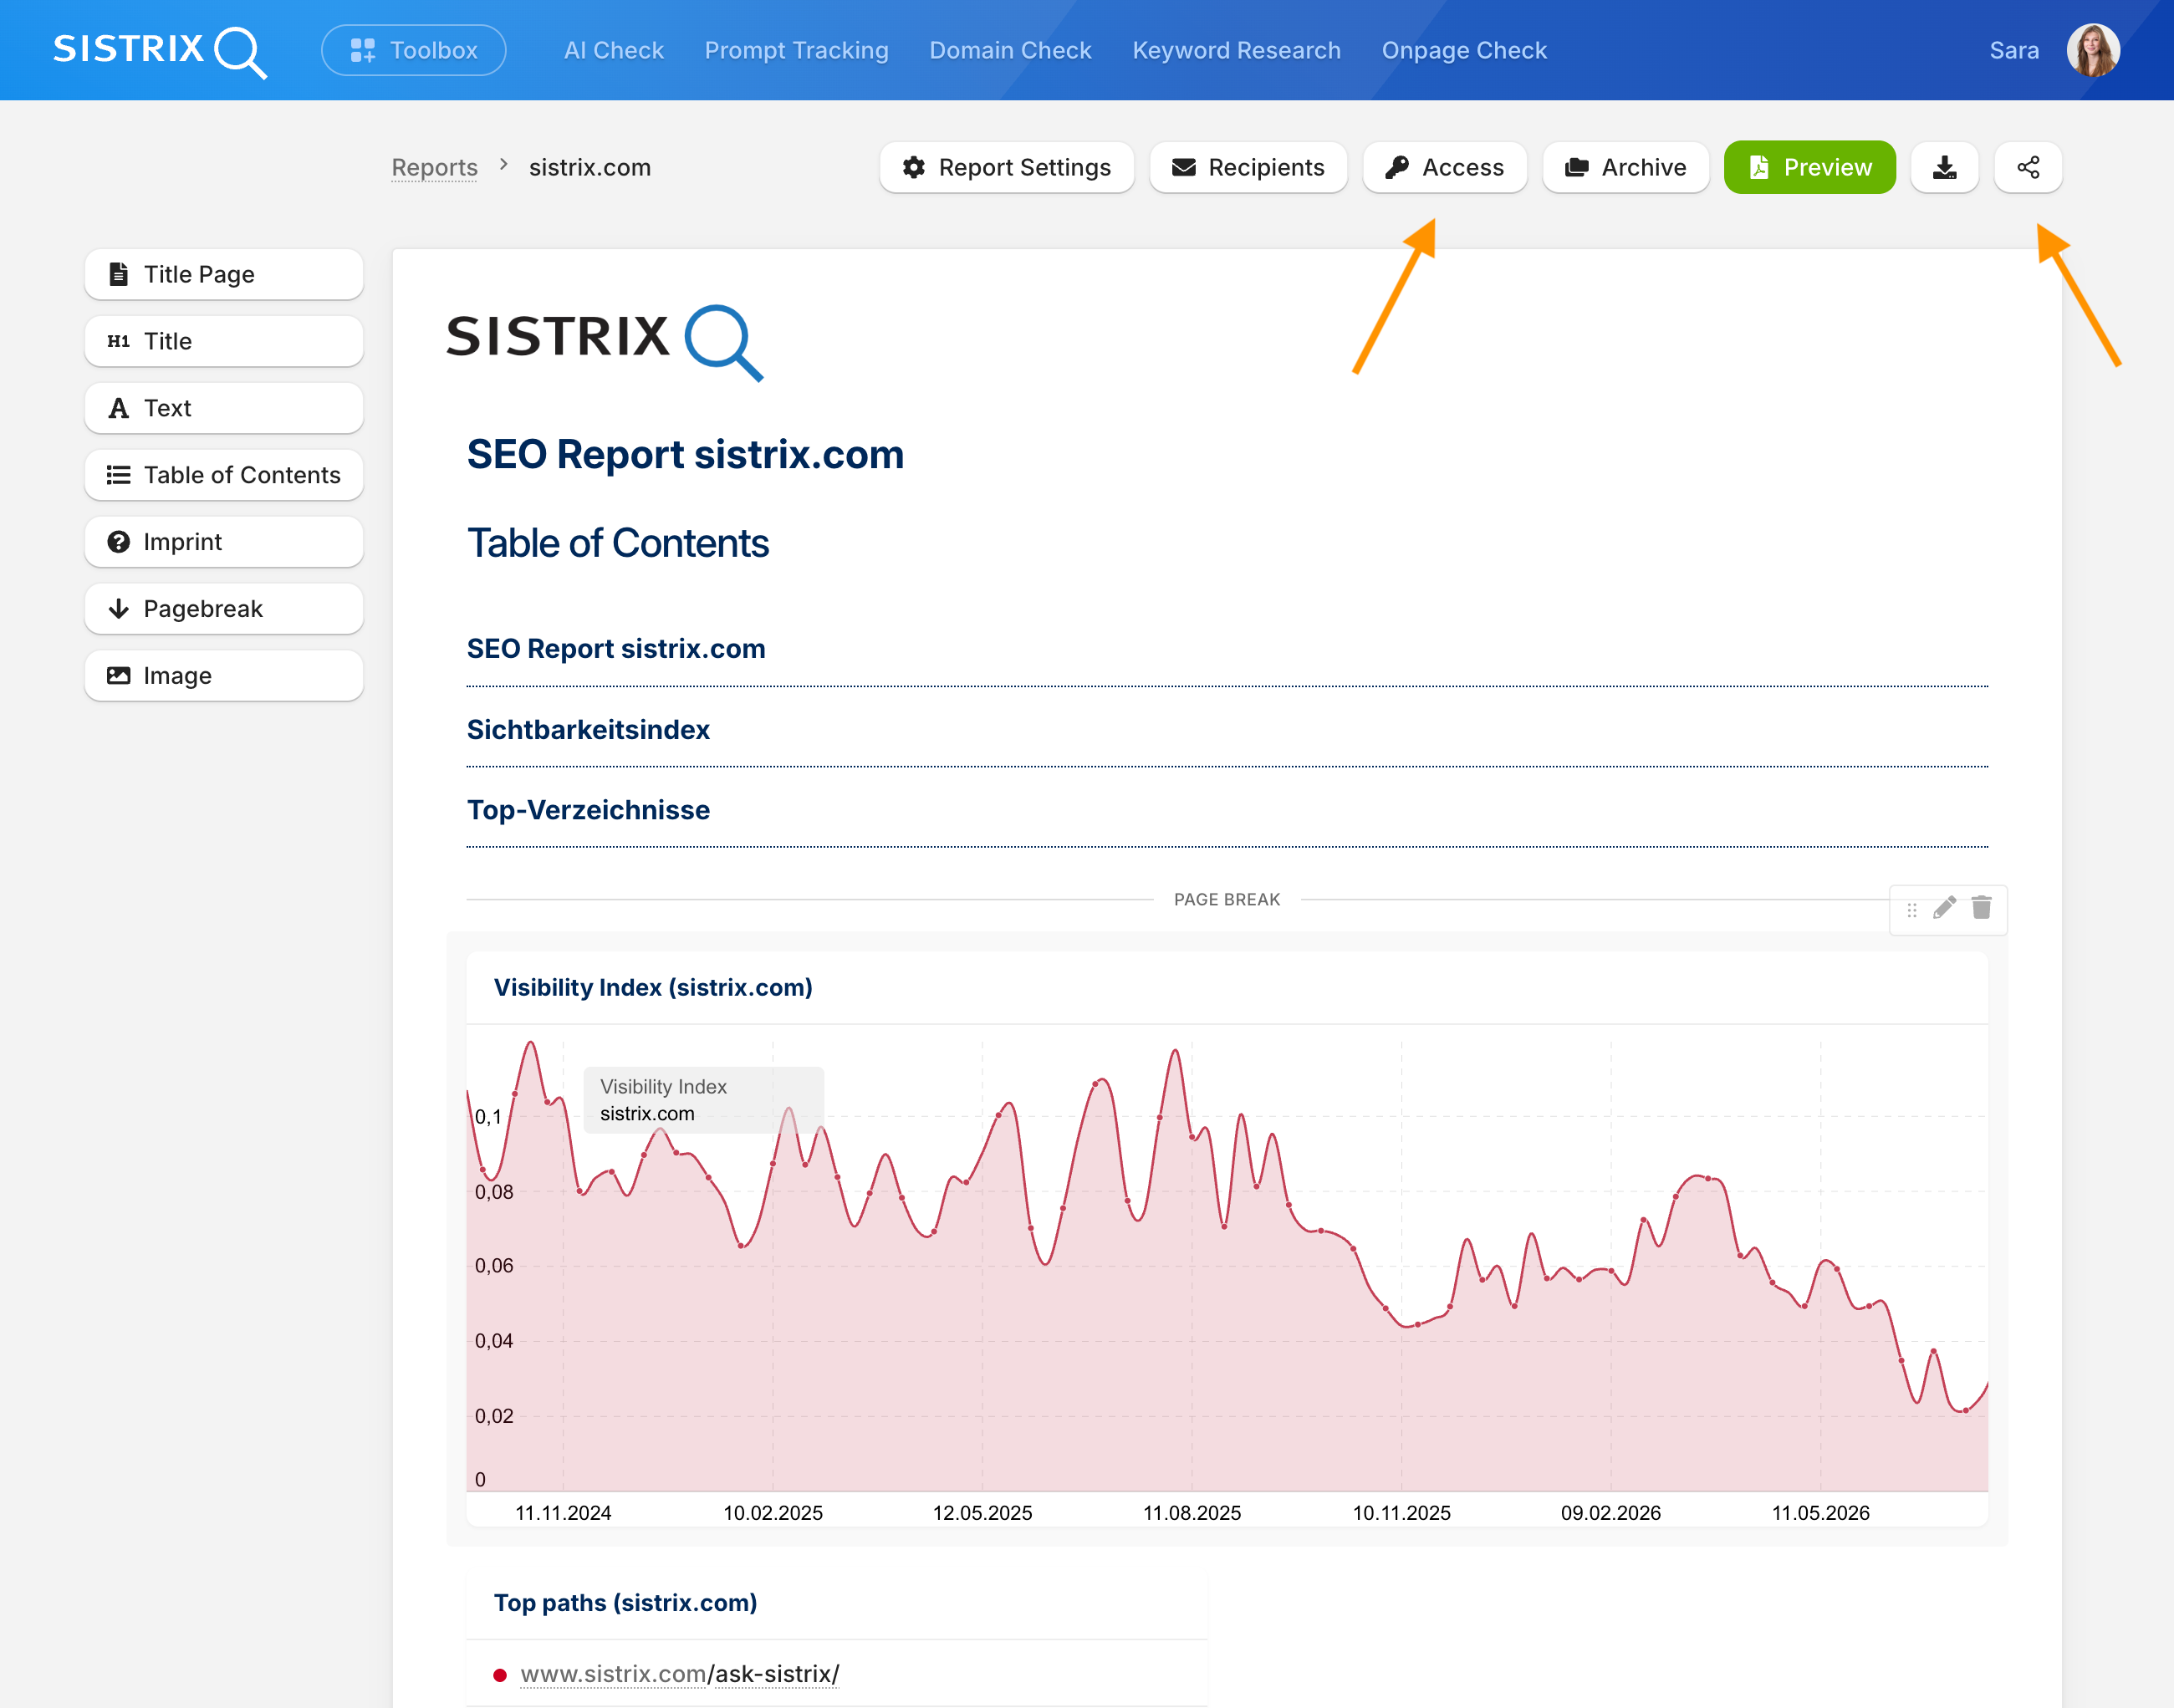
Access: Use the ‘Access’ button to specify which profiles within your account have access to the report – either all profiles in the account or specific ones. You can distinguish between view-only and editing rights: Viewers can view the report, whilst editors can also make changes to it.
Share: Using the ‘Share’ button at the top of the report editor, you can generate a link to your report as a web page. You can share this link with anyone without them having to log in to SISTRIX. The link shows the report as it stood at the time you generated it – if you make further changes to the report afterwards, these will not automatically be reflected in the existing link; you will need to generate a new link. Every link you generate is also saved in the report archive.
Preview, Export & Archive
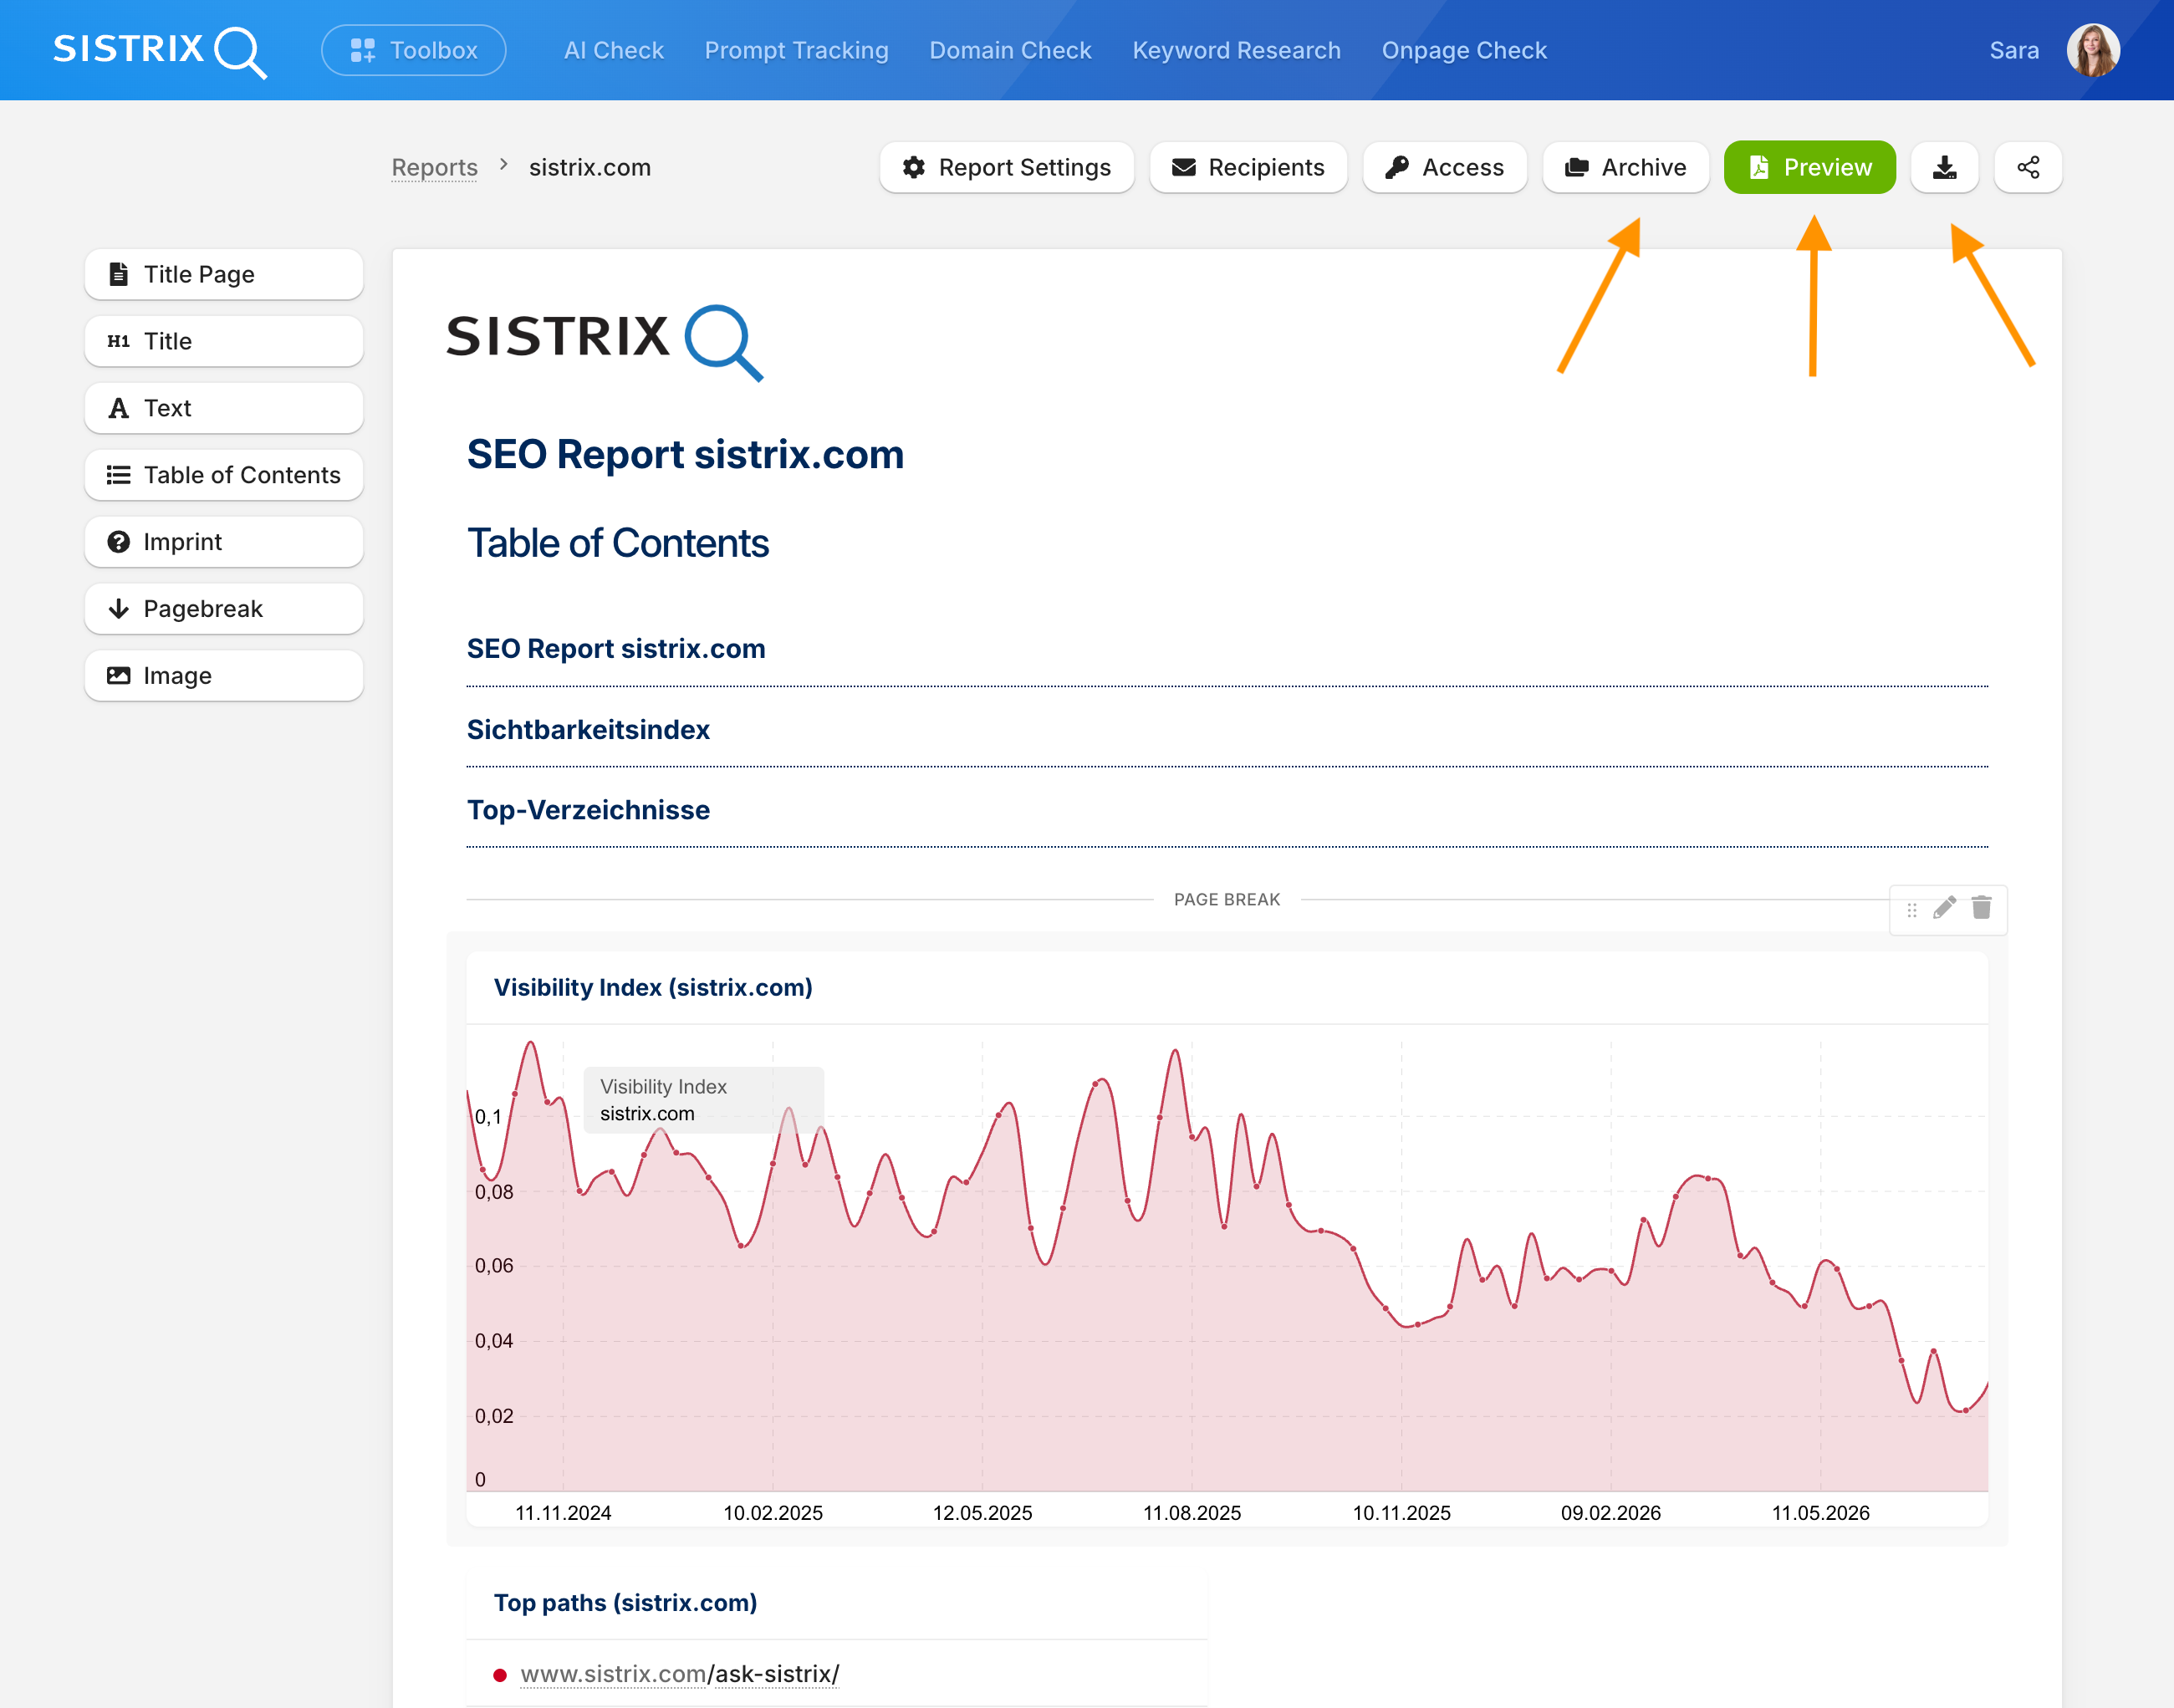
Archive: The report archive stores all automatically generated reports as PDF files, as well as all links created via ‘Share’. You can download them at any time to track their chronological development. Reports downloaded manually via ‘Export’ are not automatically saved in the archive.
Preview: Click the ‘Preview’ button to open the report as a PDF in a new tab, allowing you to get a quick overview.
Export: Click the ‘Export’ button to download the report as a PDF or PowerPoint file.
Report templates
Once you have created a report with the desired data boxes for a domain, you can also use it as a template for other domains or URLs. To do this, change the type to ‘Report template’ in the report settings – the exact layout of this report will then be saved as a template.
As well as your own templates, you’ll also find the ‘SISTRIX Template: SEO’ provided by SISTRIX amongst the report templates – this allows you to get started straight away without having to put together a report from scratch yourself.
You can find report templates on the report overview page. If you click on a template, you can view it first and customise it if necessary. You can then create the new report by clicking the green ‘Create from template’ button: enter a name and the domain or URL for which the report is to be created, then confirm by clicking ‘Create’.
The number of custom report templates you can create depends on your SISTRIX package. If you have any questions about this, our support team will be happy to help.
Design templates
Separately managed design templates are available to help you customise the visual design of your reports. You can find them on the report overview page under ‘View all reports & templates’ → ‘Design templates’. There, you can customise existing templates – for example, by adding your own logo, selecting colours and designing the report as a white-label report without SISTRIX branding.
The extent to which design templates can be customised depends on your SISTRIX package. If you have any questions, our support team will be happy to help.
Frequently asked questions
You use dashboards for your own ongoing monitoring directly within SISTRIX. Reports, on the other hand, are the format for external communication: as a document or sent automatically by email to anyone who needs to be kept regularly updated on the status without having to work in SISTRIX themselves. Find out more under “What are reports?“.
Yes. Using the “Export” button, you can download your report at any time as a PDF or PowerPoint file, without having to set up any delivery. Find out more under “Preview, Export & Archive”.
Yes. Using the ‘Share’ button, you can generate a link to your report as a web page, which you can share with anyone – without the need to log in. Find out more under “Manage & Share Access“.
The report is retained and is not lost. You can use the access rights to specify which other profiles within the account have access to the report, so that work on reports is not tied to a single person.
The number of custom report and design templates you can create depends on your SISTRIX package. If you have any questions about this, our support team will be happy to help.